 Worksheet
Visual Literacy: Reading Beaver Population Graphs
View Worksheet → Download as-is, or customize
to fit your needs.
About:
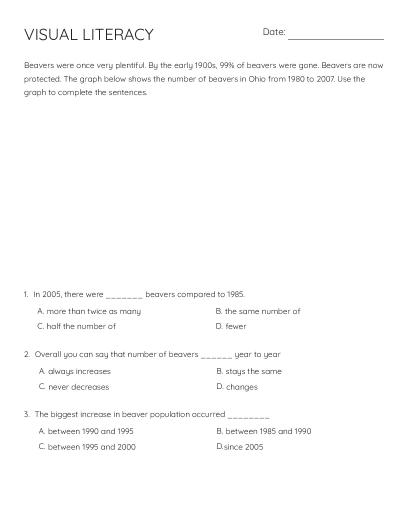
This printable data-interpretation worksheet asks learners to analyze a graph showing Ohio's beaver population from 1980 to 2007 and answer three multiple-choice questions about trends and changes. Questions cover population comparisons, year-to-year patterns, and the timing of the largest population increase. Useful for building graph-reading skills in environmental or general adult-education settings.
How to Use This Worksheet
Print this worksheet for classwork, homework, or independent practice. Click 'Open This Worksheet' to edit questions, adjust formatting, or add your own content before downloading.