 Worksheet
Representing Data with Graphs
View Worksheet → Download as-is, or customize
to fit your needs.
About:
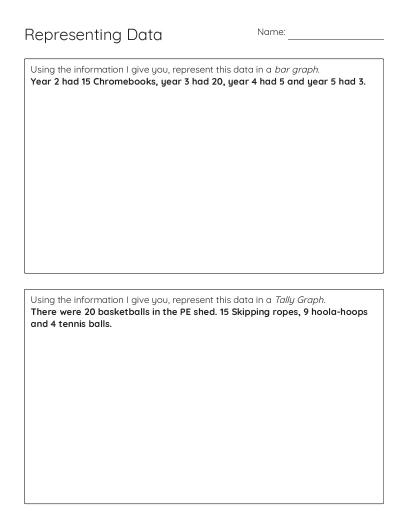
This printable worksheet gives students in Grades 3–4 practice representing data using tally graphs and bar graphs. One activity involves counting PE equipment (basketballs, skipping ropes, hoola-hoops, and tennis balls), and the other organizes Chromebook counts by school year. Useful for teaching graphing skills, data interpretation, and basic statistics concepts.
How to Use This Worksheet
Print this worksheet for classwork, homework, or independent practice. Click 'Open This Worksheet' to edit questions, adjust formatting, or add your own content before downloading.